TIR v2 is live. Virtual machines, load balancers, auto scaling groups, managed Kubernetes and PostgreSQL now live in the same project as your GPU containers, training clusters and inference endpoints. One console, one bill, one set of credentials. This post is a tour of what is there and how the pieces fit.
Why we did this
For three years E2E ran two consoles. TIR held the GPU side: notebooks, model endpoints, training clusters, private clusters. MyAccount held everything a cloud is supposed to have: VMs, load balancers, auto scaling, Kubernetes, databases, networking. That split made sense when TIR was a GPU product attached to a hosting company. It stopped making sense the first time a customer asked why the Postgres behind their retrieval app lived in a different place from the model that served it, with a different login and a different invoice.
An AI application is not a GPU. It is a GPU plus the database that holds the embeddings, the load balancer in front of the endpoint, the CPU workers that do ingestion, the cluster the app tier runs on, and the monitoring that tells you when any of it breaks. TIR v2 puts all of that in one project. Nothing here is a new product; these are services we have run for years, rebuilt into one console with one set of conventions.
What is in TIR now
The left-hand navigation is the whole catalogue. Everything below is created inside a project, shares the project's VPC and credentials, and shows up on the same bill.
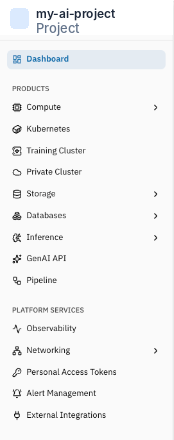
| Area | Products |
|---|---|
| Compute | Containers, Virtual Machines, Load Balancer, Auto Scaling Groups |
| Kubernetes | Managed clusters with GPU node pools |
| Training | Training Cluster (managed Slurm), Private Cluster (reserved GPU nodes) |
| Storage | Object storage, block storage, Parallel File System, Shared File System, container registry |
| Databases | PostgreSQL 17 with pgvector |
| Inference | Model endpoints, model repository, playground, gateways |
| GenAI API | Hosted open-weight models behind an OpenAI-compatible API |
| Pipeline | Scheduled and event-driven jobs |
| Platform services | Observability, networking (VPC, reserved IPs, security groups), personal access tokens, alert management, external integrations |
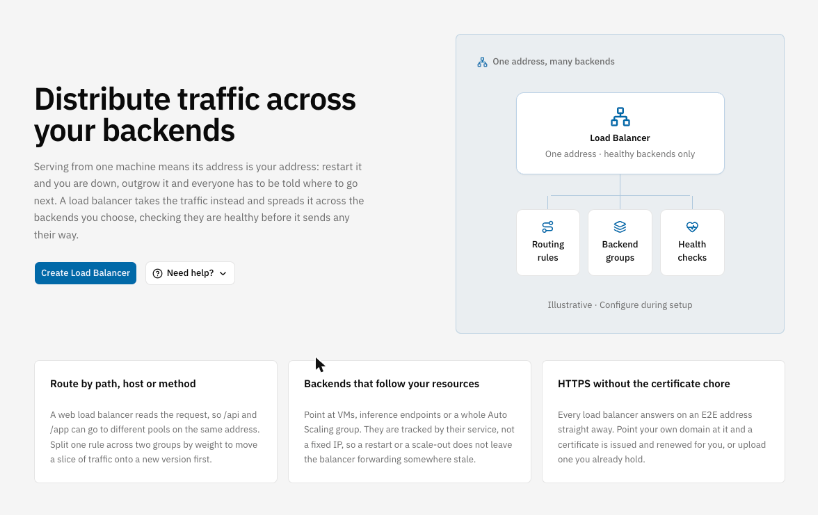
Every product page explains what the product is for before you click Create: a plain-language headline, a two-sentence description, a schematic of the parts, and three short cards on what you can do with it. We wrote those for people who are good at machine learning and have never set up a load balancer, because that is who builds on us.
Training
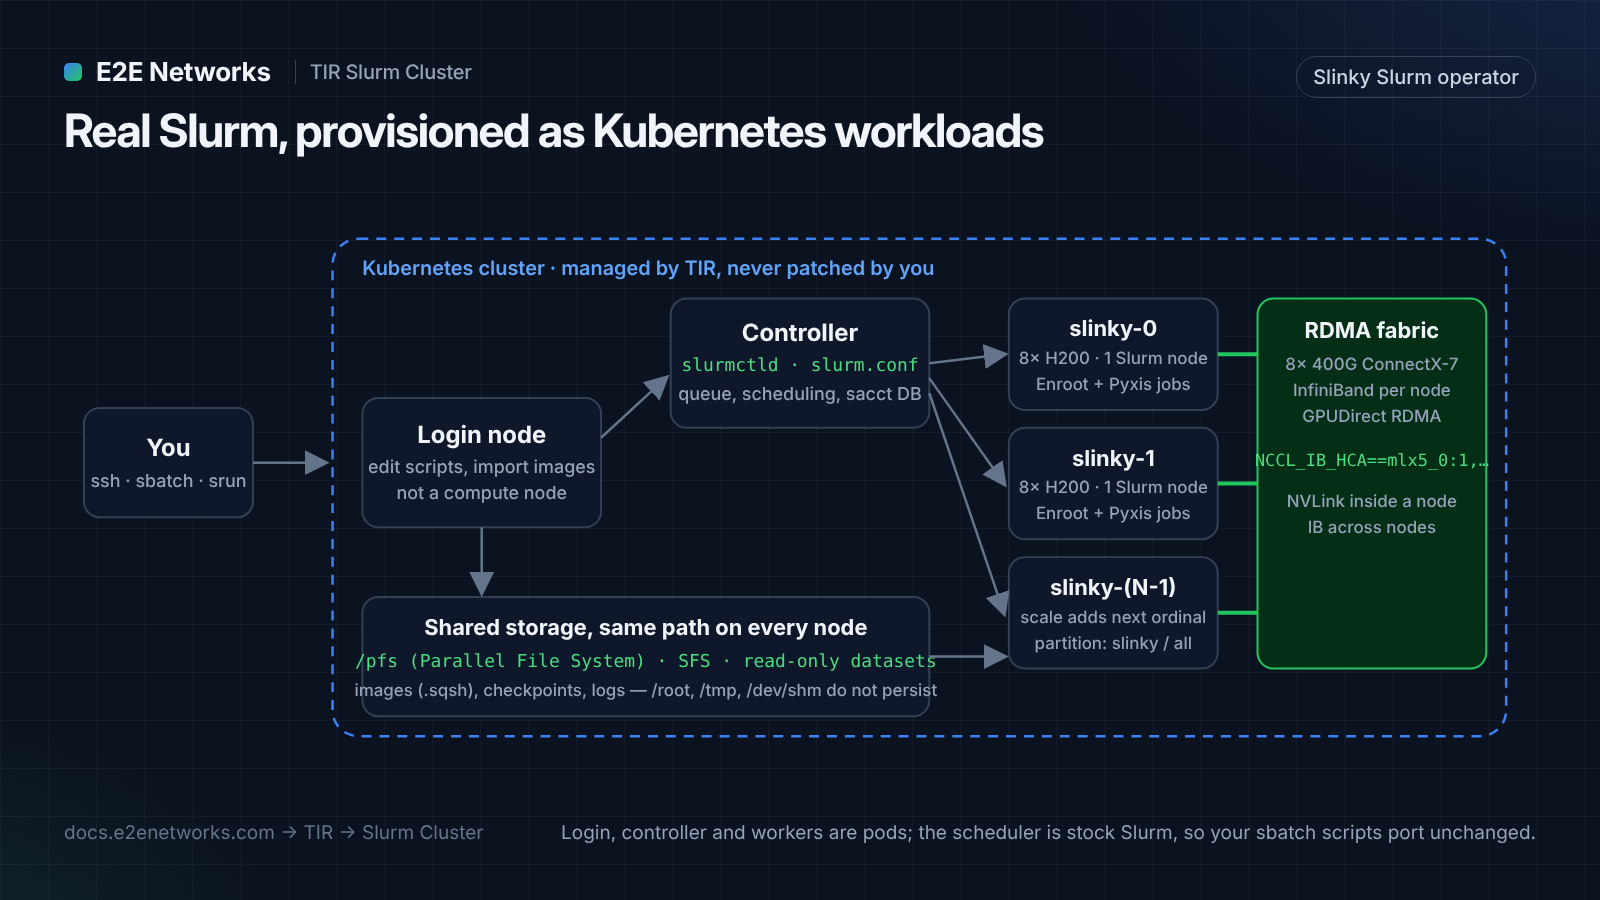
Training Cluster is stock Slurm that we run for you. You get a login node, a controller and GPU workers on an InfiniBand fabric, with PFS, SFS and read-only datasets mounted at the same path on every node. Jobs run in containers through Enroot and Pyxis, so an NGC image runs with one extra flag and no Docker daemon. You can add or remove workers on a live cluster without touching running jobs, and the console shows the job queue, GPU and scheduler charts, DCGM metrics and node logs without SSH. Billing is per node per hour; the jobs themselves are free. The H200 and B200 nodes behind it are the ones we validated at 1,024 GPUs; the numbers are in the companion post.
Private Cluster is for teams that need guaranteed capacity. You reserve dedicated GPU nodes, then allocate them to projects and return them to the pool without redeploying anything. Every node shows as Free, Allocated or Occupied, so you can see at a glance what is available. GPUs can be split with MIG for smaller workloads, and IAM roles separate admins, project managers and read-only members.
Inference
Model endpoints are serverless. You set the active and maximum worker counts and the metric to scale on; the endpoint adds and removes GPU workers to match traffic, and can run at zero workers when idle, with nothing charged until the first request starts one. Long-running requests can go through an async queue, with the status of every request tracked. Large language models are served with vLLM or SGLang behind an OpenAI-compatible API, so existing client code works by changing the base URL.
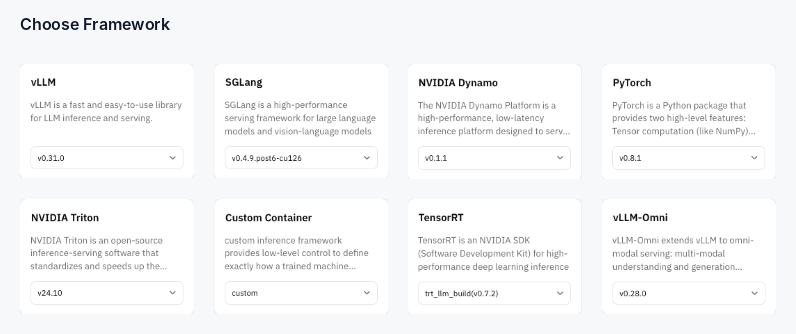
The serving stack is a per-endpoint choice: vLLM, SGLang, NVIDIA Dynamo, NVIDIA Triton, TensorRT-LLM, PyTorch, vLLM-Omni for multimodal models, or your own container with your own ports, commands and health probes. Versions are pinned per endpoint. For high-throughput LLM serving the platform supports disaggregated serving, with prefill and decode running on separate worker pools so each can be sized and scaled for its own workload profile.
Around the endpoints sit a model repository for versioned weights, a playground for trying a running endpoint and tuning its parameters, and gateways for routing and access control in front of several endpoints.
The compute that moved in
Containers are the development workspaces: pre-built images for PyTorch, TensorFlow, Transformers, vLLM and ComfyUI with CUDA preinstalled, or your own image; JupyterLab and SSH; files that persist across restarts; shared and parallel file systems and datasets mountable at launch, with AES-256 encryption. Plans cover H100, A100 and L40S GPUs, CPU-only, private-cluster nodes and spot.
Virtual Machines are full Linux systems with a dedicated kernel and root. Use them when you need custom kernel modules or control over the OS that a container cannot give you. GPU and CPU plans, hourly or committed, with start, stop, restart and clone from the console and live CPU, RAM, disk and uptime metrics.
Load Balancer gives you one address in front of many backends. It routes by path, host or method, so /api and /app can go to different pools, and you can split one rule across two groups by weight to move a slice of traffic onto a new version first. Backends can be VMs, inference endpoints or an entire auto scaling group, tracked by service rather than fixed IP, so a restart or a scale-out never leaves the balancer pointing at a stale address. HTTPS is on from the start: point your domain at it and a certificate is issued and renewed for you, or upload your own.
Auto Scaling Groups run the number of VMs your traffic needs. Set a target for CPU, memory or network and the group adds VMs when it is exceeded and removes them when demand falls; or add a schedule if you already know when your peak lands. VM and host failures are detected, and with an HTTP or TCP check on your own app, anything that fails is replaced so the group keeps its size.
Kubernetes is a managed control plane with worker node pools, including GPU pools for serving workloads, with cluster networking and load balancer IPs configured from the same place. Put your application tier where your models already are.
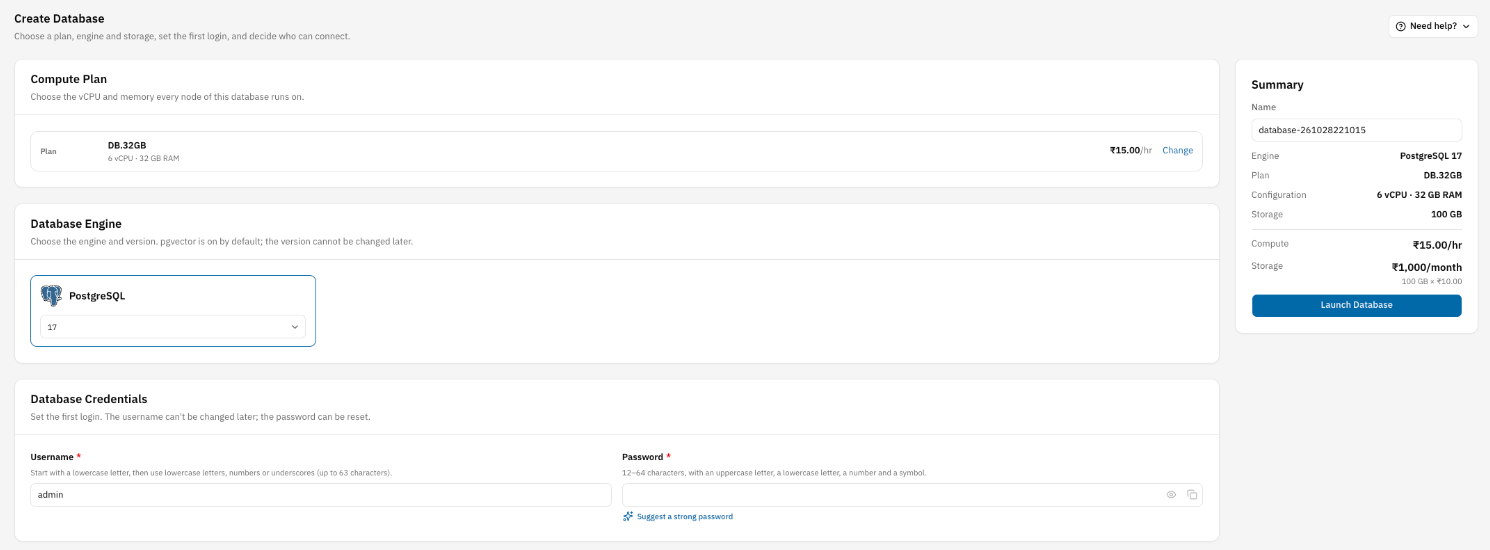
Databases is PostgreSQL 17 with pgvector enabled by default, because most of the databases our customers create now store embeddings. The create form shows compute in rupees per hour and storage in rupees per month as you change the plan and disk size, before you click Launch. Storage can grow later, not shrink, and the form says so.
Platform services
Observability is built around break-fix, not dashboards for their own sake. Node health, GPU utilisation, temperature and power are visible per node and per GPU; XID errors surface as faults with the code, the node and the GPU index, and the console offers the actions that follow: drain the node, reboot it, or restart workers. The goal is that the time between a GPU raising a fault and the job running again on healthy nodes is measured in minutes and does not need a ticket.
Networking covers the project VPC, reserved public IPs and security groups, shared by every product in the project. Personal access tokens and IAM roles handle API access and who can do what. Alert management attaches alerts to clusters and services, and external integrations connect them to the tools your team already watches.
From training run to production, without leaving the project
Here is the path a team takes on TIR v2, end to end, with every step in the same project.
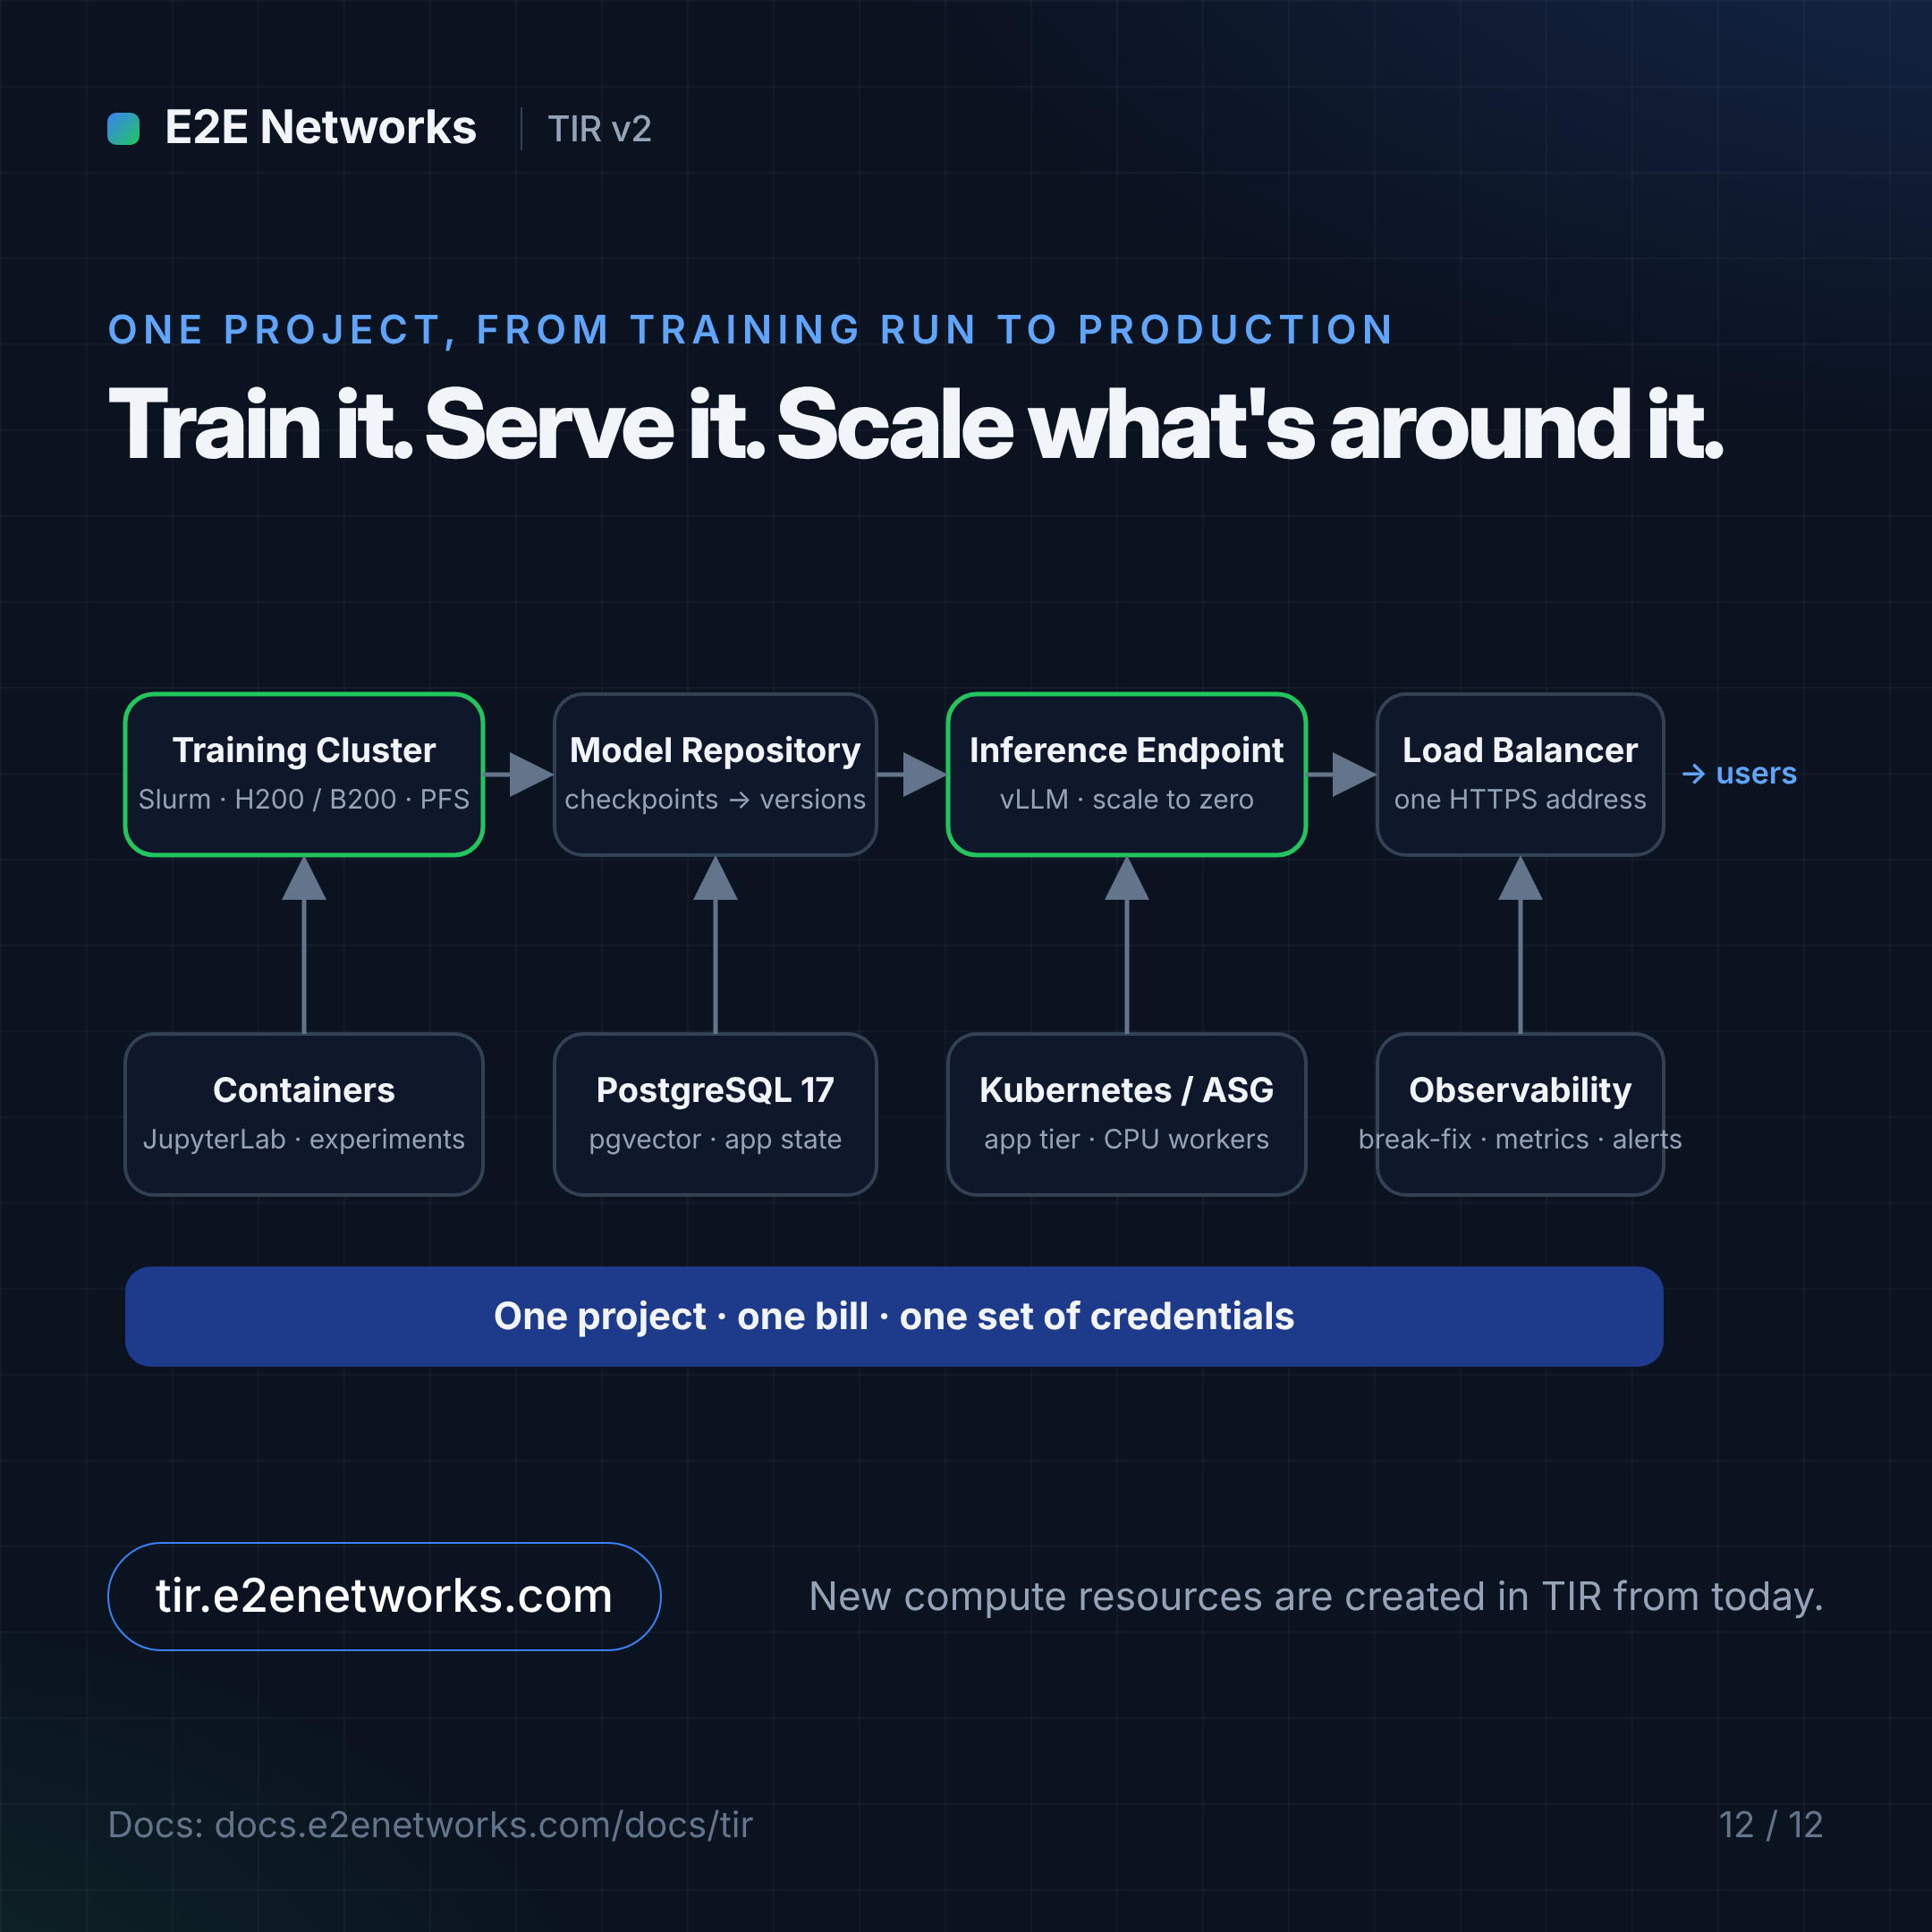
- Explore in a Container with JupyterLab, datasets mounted read-only, checkpoints on PFS.
- Scale the run on a Training Cluster: same storage paths, same container image,
sbatchinstead of a notebook cell. - Register the checkpoint in the Model Repository as a versioned model.
- Deploy it as a Model Endpoint on vLLM or SGLang, scale to zero when idle, disaggregated prefill and decode when throughput matters.
- Store embeddings and application state in PostgreSQL 17 with pgvector.
- Run ingestion and preprocessing on an Auto Scaling Group of CPU VMs that follows the queue, and the application tier on Kubernetes.
- Put a Load Balancer in front with one HTTPS address, routing
/apito the endpoint and/appto the cluster. - Watch all of it in Observability, with alerts to the channel your team already reads.
Every resource above shares one VPC, one IAM model and one invoice, and the credentials you created on day one are the ones you use on day ninety.
Getting started
TIR v2 is live today at tir.e2enetworks.com for every account, and compute is available in it from now on. Documentation for each product is at docs.e2enetworks.com/docs/tir, and the pricing page carries the per-hour rates for every GPU and CPU plan.
If you are moving an existing application onto the platform, or sizing a training run and want to talk through the architecture, our engineers will do that with you: sales@e2enetworks.com, or the Need help menu on any product page in the console.