In May 2026 we brought 128 NVIDIA HGX B200 nodes, 1,024 GPUs, online in our Chennai data centre as a single cluster built to NVIDIA's Cloud Partner reference architecture (see our launch announcement). Before any customer workload touched it, our engineering team ran it through our standard acceptance testing: HPL on every node and every scalable unit, NCCL all_reduce across the fabric, and a Nemotron-4 340B training run from 128 GPUs up to all 1,024. Below are the results, how we got them, and what they mean if you're planning to train or serve on these GPUs.
Key results at a glance
- HPL: 64,540 TFLOP/s across all 128 nodes, a 97.2% scaling efficiency. Single nodes ranged from 513 to 522 TFLOP/s.
- NCCL all_reduce: 385.7 GB/s bus bandwidth in each 256-GPU scalable unit and 360.4 GB/s across all 1,024 GPUs, against a 320 GB/s acceptance threshold.
- Nemotron-4 340B training (BF16): 412,825 tokens per second on 1,024 GPUs, keeping 96% of the per-GPU throughput measured on 128 GPUs.
- Consistency: the four scalable units were within 0.12% of each other on NCCL, and our October NCCL sweep returned zero data-integrity errors.
The cluster: 128 HGX B200 nodes in four scalable units
The E2E B200 cluster is four scalable units (SUs) of 32 nodes each. Every node is an HGX B200 with eight GPUs, 180 GB of HBM3e per GPU, NVLink inside the node, and eight NVIDIA ConnectX-7 400G InfiniBand rails for the compute fabric, with GPUDirect RDMA. Two more 200G Ethernet ports per node carry storage and front-end traffic, and two BlueField-3 ports handle management.
Storage is a Parallel File System mounted at the same path on every node. That's where container images, checkpoints and logs live during a training run. Scheduling is Slurm 25.05.6, the same scheduler the TIR Training Cluster gives customers. We covered how multi-node jobs run on it in our Slurm training guide.
| Component | Per node | Cluster |
|---|---|---|
| GPUs | 8× NVIDIA B200, 180 GB HBM3e | 1,024 |
| Compute fabric | 8× 400G InfiniBand (ConnectX-7), GPUDirect RDMA | 8 × 400 Gb/s per node |
| Storage / front-end | 2× 200G Ethernet | Parallel File System, shared path |
| Management | 2× BlueField-3 | out-of-band management |
| Scalable units | 32 nodes / 256 GPUs | 4 SUs |
How was the B200 cluster validated?
We used three tests, and each answers a different question:
- HPL (High-Performance Linpack) checks that every node delivers its rated compute and that groups of nodes scale. It stresses the GPUs and the fabric at the same time.
- NCCL (NVIDIA Collective Communications Library) all_reduce checks the InfiniBand fabric under the exact communication pattern data-parallel training uses. It's the test most sensitive to a bad cable, a misconfigured rail or a degraded switch port.
- A Nemotron-4 340B training run checks that the cluster behaves like a training cluster, with a real framework, real checkpoints and real step times.
All three tests ran on a dedicated system with nothing else on the nodes: no monitoring agents, no other daemons, and the stock OS image. Treat them as the ceiling for this hardware and software stack. Production runs usually have monitoring switched on, so expect slightly lower figures. The pass criteria were HPL groups within 5% of each other and NCCL out-of-place bandwidth of at least 320 GB/s at the largest buffer.
Software stack used in the acceptance tests:
| Layer | Version |
|---|---|
| Node OS | DGX OS 7.4.0 (Ubuntu 24.04) |
| GPU driver | 580.126.09 |
| DOCA OFED | 3.2.1 |
| Slurm | 25.05.6 |
| HPL and NCCL | NGC hpc-benchmarks 25.09 |
| Nemotron training | NGC nemo 25.11 |
How well does HPL scale across 128 B200 nodes?
HPL reached 64,540 TFLOP/s across all 128 nodes, a 97.2% scaling efficiency. We first ran HPL on every node on its own. Single-node results across the fleet ranged from 513 to 522 TFLOP/s, a 1.8% spread, which is within the variation you expect from silicon and thermals. We then ran groups of 2, 4, 8, 16, 32, 64 and 128 nodes inside each SU and across the whole cluster. Scaling efficiency is the measured result divided by the single-node result times node count.
| Nodes | Max TFLOP/s | Min TFLOP/s | Variation | Scaling efficiency |
|---|---|---|---|---|
| 1 | 522.3 | 513.1 | 1.8% | — |
| 2 | 1,061 | 1,042 | 1.8% | 101.6% |
| 4 | 2,130 | 2,096 | 1.6% | 102.1% |
| 8 | 4,236 | 4,176 | 1.4% | 101.6% |
| 16 | 8,374 | 8,282 | 1.1% | 100.6% |
| 32 | 16,390 | 16,310 | 0.5% | 98.7% |
| 64 | 32,260 | 32,150 | 0.3% | 97.2% |
| 128 | 64,540 | 64,470 | 0.1% | 97.2% |
The four SUs are interchangeable: their 32-node results were 16,390, 16,400, 16,400 and 16,380 TFLOP/s, so it doesn't matter which SU your job lands on.
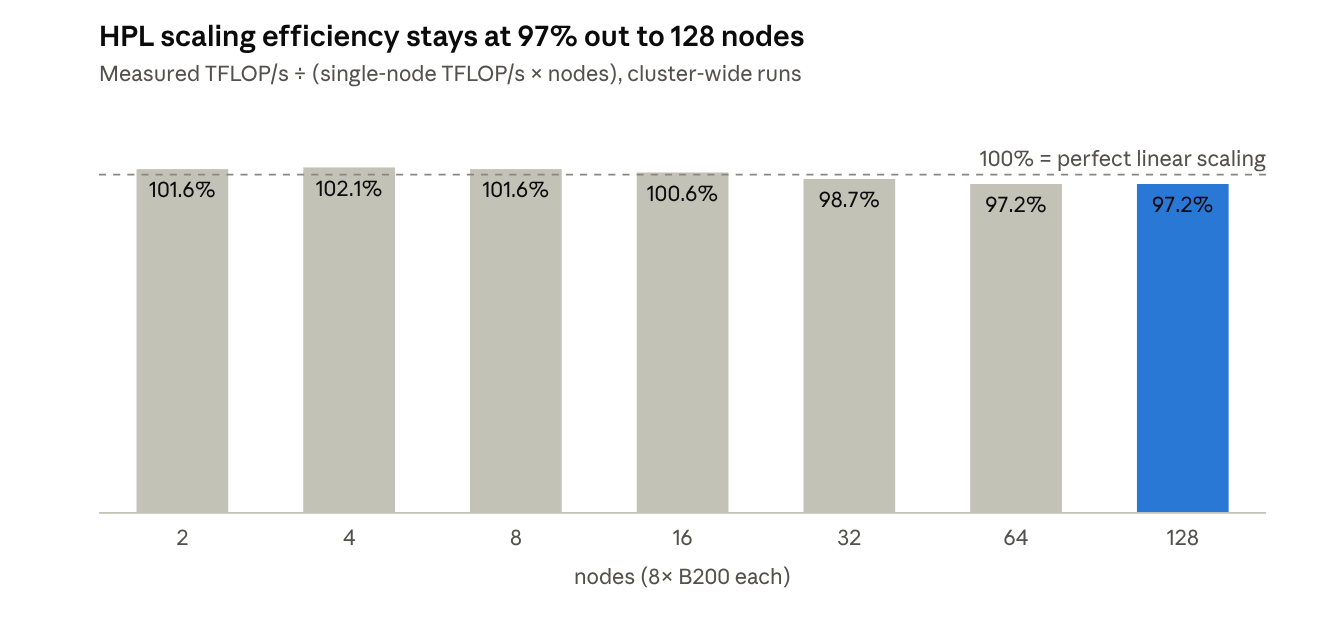
HGX B200 acceptance run, May 2026 · cluster-wide HPL, 2 to 128 nodes
What NCCL all_reduce bandwidth does the B200 cluster reach?
Each 256-GPU scalable unit reached 385.7 GB/s of NCCL all_reduce bus bandwidth, and all 1,024 GPUs together reached 360.4 GB/s, against a 320 GB/s pass threshold. NCCL's all_reduce is the collective that dominates data-parallel training, so it's the fabric test that matters. The acceptance run reports out-of-place bus bandwidth at the largest buffer size, per SU and then cluster-wide.
| Metric | SU1 | SU2 | SU3 | SU4 | Cluster, 128 nodes |
|---|---|---|---|---|---|
| Max bus BW (GB/s) | 385.73 | 385.73 | 385.73 | 385.72 | 360.43 |
| Min bus BW (GB/s) | 385.27 | 385.28 | 385.28 | 385.72 | 360.11 |
| Variation (max−min)/max | 0.12% | 0.12% | 0.12% | 0.00% | 0.09% |
The four SUs are identical to the second decimal place. For context, a commonly published acceptance criterion for 32-node subsets is under 1% variance; our SUs varied by 0.12%. Cluster-wide at 128 nodes the figure is 360.43 GB/s, 6.6% below a single SU and 12.6% above the 320 GB/s acceptance threshold.
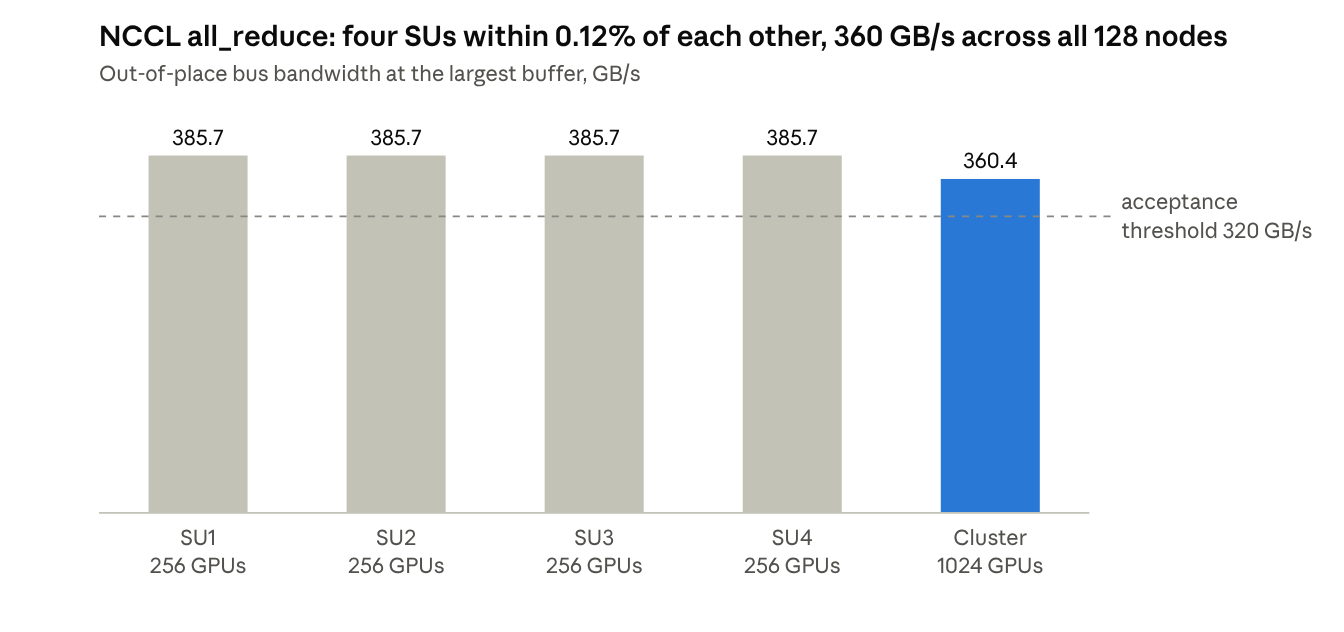
HGX B200 acceptance run, May 2026 · NCCL all_reduce, max out-of-place bus bandwidth per SU and cluster-wide
Our own NCCL sweep after handover
After handover, we ran our own sweep on B200 with NCCL 2.27.7 and CUDA 13.0, using all_reduce_perf_mpi with float32 sum, 100 iterations per message size and validation enabled, from 8 MiB up to 16 GiB. The average across the whole sweep is a harsher number than the peak because small messages are latency-bound, but it's closer to what a mixed training step sees.
| Run | Nodes / GPUs | Avg bus BW, 8 MiB–16 GiB (GB/s) | Peak bus BW, ≥4 GiB (GB/s) | Integrity errors |
|---|---|---|---|---|
| SU1 | 32 / 256 | 220.74 | 385.55 | 0 |
| SU2 | 32 / 256 | 221.10 | 385.55 | 0 |
| SU3 | 31 / 248 | 219.04 | 384.50 | 0 |
| SU4 | 32 / 256 | 221.01 | 385.52 | 0 |
| SU1 + SU2 | 64 / 512 | 206.45 | 384.89 | 0 |
Joining two SUs into one 512-GPU job left the peak at 384.89 GB/s and lowered the sweep average by 6.5%. All five runs completed with zero data-integrity errors.
Bus bandwidth is the figure nccl-tests reports for all_reduce; it isn't a measure of InfiniBand line-rate utilisation and shouldn't be compared to the per-rail 400G figure.
How fast does Nemotron-4 340B train on 1,024 B200 GPUs?
On all 1,024 GPUs, Nemotron-4 340B trained at 412,825 tokens per second in BF16, keeping 96% of the per-GPU throughput measured on 128 GPUs. HPL and NCCL show the hardware is healthy. A real training run shows whether everything holds up together. The acceptance suite trains Nemotron-4 340B in BF16 at sequence length 4,096 using the NGC NeMo 25.11 container, doubling the job from 16 nodes to 128 while scaling the global batch with it.
| Nodes | GPUs | Global batch | Step time (s) | TFLOP/s per GPU | Tokens/s | Tokens/s per GPU | Days to 1T tokens |
|---|---|---|---|---|---|---|---|
| 16 | 128 | 32 | 2.44 | 864.14 | 53,690.52 | 419.45 | 215.57 |
| 32 | 256 | 64 | 2.51 | 840.02 | 104,232.20 | 407.15 | 111.04 |
| 64 | 512 | 128 | 2.53 | 831.96 | 206,819.72 | 403.94 | 55.96 |
| 128 | 1,024 | 256 | 2.54 | 829.62 | 412,825.19 | 403.14 | 28.03 |
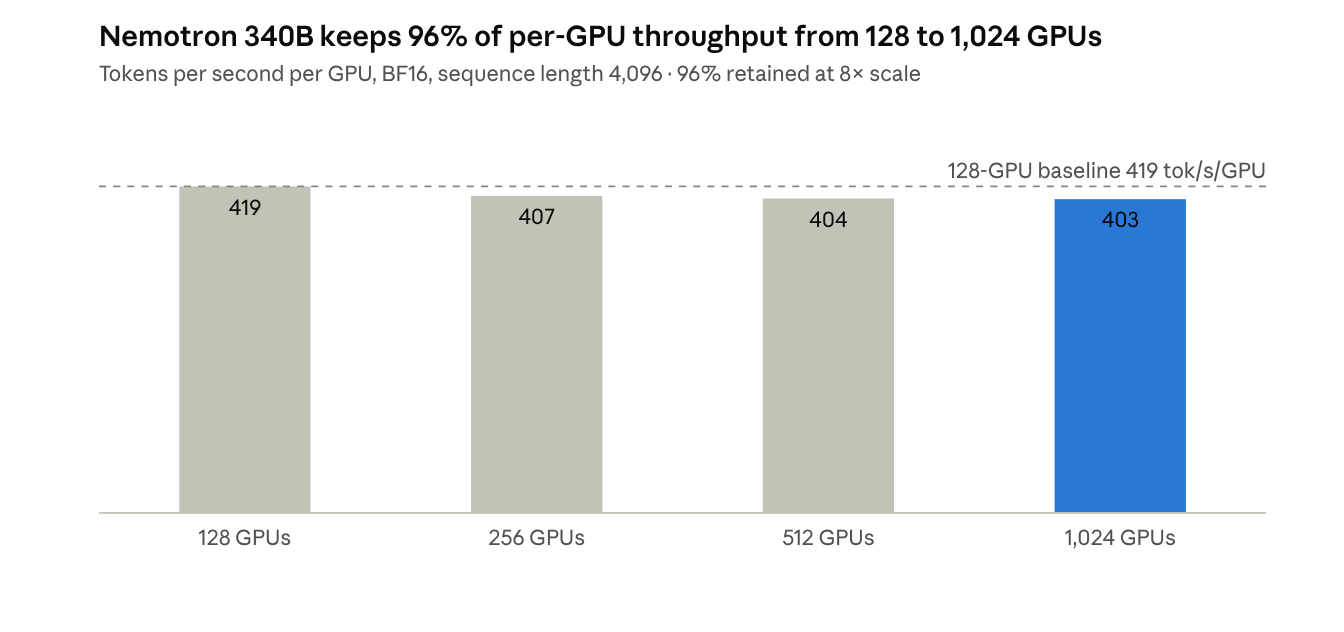
HGX B200 acceptance run, May 2026 · Nemotron-4 340B BF16, NeMo 25.11, 128 to 1,024 GPUs
Step time grows from 2.44 s to 2.54 s across an 8× scale-out, and tokens per second per GPU falls from 419.45 to 403.14, a 3.9% drop. At 1,024 GPUs the cluster processes 412,825 tokens per second on the 340B model, and the report's time to train one trillion tokens is 28.03 days. Throughput is sequence length × global batch ÷ step time; days-to-1T is total tokens ÷ throughput ÷ 86,400. The acceptance run reports TFLOP/s per GPU; it doesn't report MFU, so none is given here.
Tokens per second per GPU is the number to watch. It barely moves between 128 and 1,024 GPUs, so you can size a large run from a small pilot and trust the projection.
What do these results mean for training or serving on E2E?
Any SU you're allocated performs like the ones in this post. With HPL within 0.1% and NCCL within 0.12% across four SUs, capacity planning doesn't need a per-SU fudge factor, and a job that moves between SUs after a maintenance window won't change speed.
A 512- or 1,024-GPU job will scale the way your pilot said it would: HPL holds 97.2% scaling efficiency at 128 nodes, and the Nemotron-4 340B run keeps 96% of per-GPU throughput at 1,024 GPUs.
We checked data integrity on every NCCL run in our October sweep, and none returned an error. The acceptance run also cleared the 320 GB/s threshold on every SU and cluster-wide.
These are the same nodes behind the Training Cluster and Private Cluster products in TIR, scheduled by stock Slurm with Enroot and Pyxis for containers and the Parallel File System (PFS) mounted on every worker. You don't need to reproduce the acceptance suite to use them, but you can.
How can you reproduce these tests?
The HPL and NCCL runs use the NGC hpc-benchmarks container and the launch scripts NVIDIA ships with it. On a TIR Training Cluster, from the login node:
cd ~/hpc-main/validation/hpl/
./launch_hpl_experiment.sh -s dgxb200_192G -c 1 -i 10

# NCCL all_reduce, same shape
cd ~/hpc-main/validation/nccl/
./launch_nccl_experiment.sh -s dgxb200_192G -c 1 -i 10

# ./launch_*_experiment.sh -h lists the node-count and iteration options
Our October sweep used nccl-tests' all_reduce_perf_mpi with NCCL 2.27.7 and CUDA 13.0: float32 sum, message sizes from 8 MiB to 16 GiB, 100 iterations per size, data validation enabled, one GPU per rank across 32 nodes per SU and 64 nodes for the joined run.
From our own H200 runs, do three checks before you trust any NCCL number:
ls /dev/infinibandinside the container must not be empty on every node.ibv_devinfo -lmust be run per node because device numbering can differ.- With
NCCL_DEBUG=INFO, the log should show/IBentries (not/RoCE), cross-nodeGDRDMAchannels and intra-nodeP2P/CUMEM. If you seeNET/Socket, NCCL can't see InfiniBand.
The Nemotron run uses the NGC NeMo 25.11 container with the Nemotron-4 340B BF16 configuration at sequence length 4,096, with global batch scaled with node count as in the table above.
What's next
Benchmarks show how fast a cluster can go, but not whether it stays that fast over the weeks a real training run takes. Part 2 covers that: how we keep this cluster healthy in production, and what happens when a GPU, a link or a node fails mid-job.
Planning a training run or an inference deployment on B200? Talk to us. Our engineers will walk you through the validation data for the SU you'll be allocated, help you size the job from a pilot, and run the same checks with you before your first production step. Reach us at sales@e2enetworks.com or through the console at tir.e2enetworks.com.