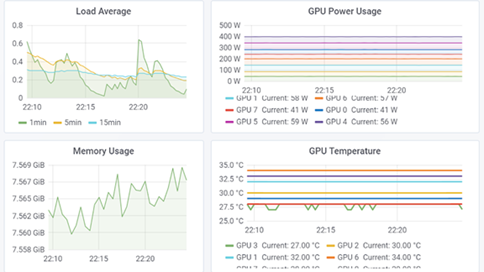
For infrastructure or site reliability engineering (SRE) teams dealing with large GPU clusters for artificial intelligence (AI) or high-performance computing (HPC) workloads, monitoring GPUs is crucial. GPU metrics let teams quickly identify workload behavior, allowing them to better allocate and utilize resources, troubleshoot anomalies, and improve overall data center performance. Whether you're a researcher focusing on GPU-accelerated machine learning processes or a data center designer interested in GPU utilization and saturation for capacity planning, measurements may be of relevance to you.

Scaled by leveraging, the container management technologies like Kubernetes, containerized AI/ML workloads and their patterns get even more relevant. In this article, we'll go through how NVIDIA Data Center GPU Manager (DCGM) can be integrated with open-source tools like Prometheus and Grafana to form the foundation of a Kubernetes GPU monitoring solution.
NVIDIA DCGM Exporter
DCGM, at its core, is a smart, lightweight user-space library/agent that performs a variety of tasks on each host system. It facilitates NVIDIA Tesla GPU administration in cluster and datacenter environments. The NVIDIA DCGM incorporates GPU telemetry APIs which analyze GPU utilization measurements for monitoring Tensor Cores, FP64 units, memory metrics, and interconnect traffic metrics. There are Go bindings based on the DCGM APIs for integration within the container environment, where Go is a prominent programming language.
A collector, a time-series database for storing metrics, and a display layer are the common components of monitoring stacks. Prometheus is a widely used open-source stack that is used to construct complex dashboards with Grafana as the visualization tool. A feature of Prometheus that allows you to generate and manage alerts is the Alertmanager. Prometheus is used in conjunction with Kube-state-metrics and node exporter to offer cluster-level and node-level metrics for Kubernetes API objects.

Source: Prometheus documentation
The functions performed by DCGM include:
-
Monitoring the GPU's performance - NVSwitch is the point of interaction for all GPUs on DGX-2 or HGX-2. Configuring the switches to form a single memory fabric for all the GPUs involved and supervising the fabric's NVLinks is done by DCGM's Fabric Manager component.
-
Management of GPU configuration - Users can tailor the behavior of NVIDIA GPUs to meet the needs of certain settings or applications, encompassing clock settings, exclusive constraints like computing mode, and environmental controls like power limits, among other facets. DCGM provides enforcement and persistence techniques to ensure that associated GPUs behave consistently.
-
Governing GPU health and diagnostics by GPU policy - Featuring sophisticated capabilities, the NVIDIA GPUs help with error detection and containment. Higher dependability and a simpler administrative environment are ensured by automated policies that govern GPU reaction to certain groups of events, such as recovery from faults and isolation of faulty hardware. DCGM has policies in place for common scenarios that necessitate notice or automatic action.
Another critical requirement is the ability to determine the health of a GPU and its interaction with the surrounding system. Manifesting itself in a variety of ways, this demand ranges from passive background monitoring to rapid system validation to in-depth hardware diagnostics. In all of these instances, it's crucial to provide these functions with as little impact on the system and a few new environmental needs as possible. DCGM has a wide range of health and diagnostic capabilities, both automated and non-automated.
- Analyze process statistics and GPU accounting - Schedulers and resource managers need to know how GPUs are used. Combining this data with RAS events, performance data, and another telemetry, particularly at the boundaries of a workload, is extremely helpful in explaining task behavior and identifying the source of any performance or execution difficulties. At the job level, DCGM provides a framework for gathering, grouping, and analyzing data**.**
Per-pod GPU metrics in a Kubernetes cluster
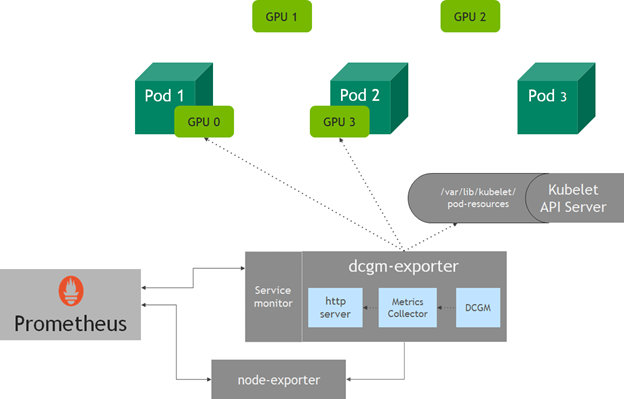
dcgm-exporter captures metrics for all of a node's GPUs. However, when a pod asks for GPU resources in Kubernetes, you may not know which GPUs in a node will be assigned to it. With v1.13, kubelet added a device monitoring functionality that enables you to use a pod-resources socket to find out which devices are assigned to the pod—pod name, pod namespace, and device ID. The dcgm-exporter HTTP server connects to the kubelet pod-resources server (/var/lib/kubelet/pod-resources) to identify the GPU devices running on a pod and adds the GPU device pod information to the metrics collected.

DCGM features a multitude of user interfaces to cater to various consumers and use cases. Intended for integration with third-party software, the usage of C and Python languages are utilized. Python interfaces are also designed for scripting contexts where the administrator is in charge. CLI-based tools are available to provide end-users with an interactive experience right out of the box. Each interface has nearly the same amount of capability. The functionality and design of the NVIDIA DCGM are mainly targeting the following users:
- OEMs and independent software vendors (ISVs) who want to enhance GPU integration in their software.
- Administrators are in charge of their own GPU-enabled infrastructure.
- own GPU-enabled infrastructure.
- Individual users and FAEs who require more information on GPU usage, particularly during problem analysis.
- The Fabric Manager will be used by all DGX-2 and HGX-2 users to set up and analyze the NVSwitch fabric.