Monitoring Kubernetes with Prometheus and Grafana

October 31, 2022

Monitoring your Kubernetes cluster is critical for ensuring that your services are always available and running. And before you scour the internet for a monitoring system, why not try Grafana and Prometheus Kubernetes cluster monitoring?

Grafana and Prometheus Kubernetes Cluster Monitoring report on potential performance bottlenecks, cluster health, and performance metrics. Visualize network consumption, pod resource utilization trends, and a high-level summary of cluster activity all at once.

In this article, you will learn what are Prometheus and Grafana for Kubernetes monitoring and how to monitor your Kubernetes cluster, viewing internal state metrics with Prometheus and the Grafana dashboard.

Table of contents:

  1. Introduction to Prometheus and Grafana
  2. How to monitor Kubernetes cluster using Prometheus and Grafana 
  3. Create Namespace and Add Helm Charts Repo
  4. Deploying Helm Charts to Created Namespace
  5. Accessing the Prometheus Instance and Viewing the Internal State Metrics
  6. Visualizing a Cluster’s Internal State Metric on Prometheus
  7. Monitoring and Visualizing with Grafana Dashboards
  8. Conclusion
  1. Introduction to Prometheus and Grafana

Prometheus

There are many open-source time-series databases available today, including Graphite, InfluxDB, and Cassandra, but none are as well-liked among Kubernetes users as Prometheus. Prometheus, which started out as a SoundCloud project and is now a part of CNCF (Cloud Native Computing Foundation), has become the open-source de-facto standard for monitoring Kubernetes.

In a nutshell, Prometheus's multi-dimensional data model, PromQL (the Prometheus querying language), built-in alerting features, a pull vs. push approach, and, of course, the always expanding community are what set it apart from other time-series databases. The two projects are now tightly connected, allowing users to quickly operate Prometheus on top of Kubernetes using the Prometheus Operator. These differentiators make Prometheus a great option for Kubernetes users. 

Grafana 

An open-source, cross-platform online application for interactive visualization and analytics is called Grafana. When connected to supported data sources, it offers charts, graphs, and alerts for the web. It is extendable using a plug-in architecture. A licensed Grafana Enterprise version with additional features is also available as a self-hosted installation or an account on the Grafana Labs cloud service. Using interactive query builders, end users may design sophisticated monitoring dashboards. The front end and back end of Grafana are each composed of TypeScript and Go code, respectively.

There are a number of reasons Grafana is so popular, its ability to integrate with a long list of data sources being one of them. Grafana is extremely robust, featuring a long list of capabilities such as alerts, annotations, filtering, data source-specific querying, visualization and dashboarding, authentication/authorization, cross-organizational collaboration, and plenty more. 

  1. How to monitor Kubernetes cluster using Prometheus and Grafana: step by step guide

If you want to create your own monitoring dashboard for your Kubernetes cluster. You’ll be using Prometheus (https://prometheus.io//) to handle the extraction, transformation, and loading of all your assets from the Kubernetes cluster. Grafana will be used for querying, visualizing, monitoring, and notifying.

Prerequisites: 

  1. Create Namespace and Add Helm Charts Repo

The first step is to create a namespace in the Kubernetes cluster. It will establish a separate place in your Kubernetes cluster for the Prometheus and Grafana servers to be deployed into.

kubectl create namespace monitoring

After you have run the above commands, you need to add the Prometheus-community helm repo and also update the repo. To do so, run the following commands.

# Add prometheus-community repo

helm repo add prometheus-community https://prometheus-community.github.io/helm-charts

# Update helm repo

helm repo update

  1. Deploying Helm Charts to Created Namespace

Run the helm install command listed below to deploy the Helm chart for the kube-prometheus stack after adding the Helm repo. You can use any other name in place of "monitoring."

This Helm chart configures a thorough Prometheus Kubernetes monitoring stack by acting on a collection of Custom Resource Definitions (CRDs). Run the following commands to deploy the chart to the Kubernetes cluster.

helm install prometheus prometheus-community/kube-prometheus-stack --namespace monitoring

To verify the deployment of your Kube-Prometheus stack, run the following command.


kubectl get pods -n monitoring
  1. Accessing the Prometheus Instance and Viewing the Internal State Metrics

The next step is to utilize Prometheus and Grafana to monitor your Kubernetes cluster after you have successfully deployed their instances there. To accomplish this, we must allow traffic to the Prometheus pod in order to monitor the internal metrics of your cluster. You will be able to use your browser to access the Prometheus server as a result. To find out which Prometheus server you will be redirecting traffic to, run the command below.


kubectl get svc -n monitoring

Next, run the below kubectl port-forward command to forward the local port 9090 to your cluster via the Prometheus service (svc/monitoring-kube-prometheus-prometheus). To do so run the following commands.


kubectl port-forward svc/prometheus-kube-prometheus-prometheus -n monitoring 9090

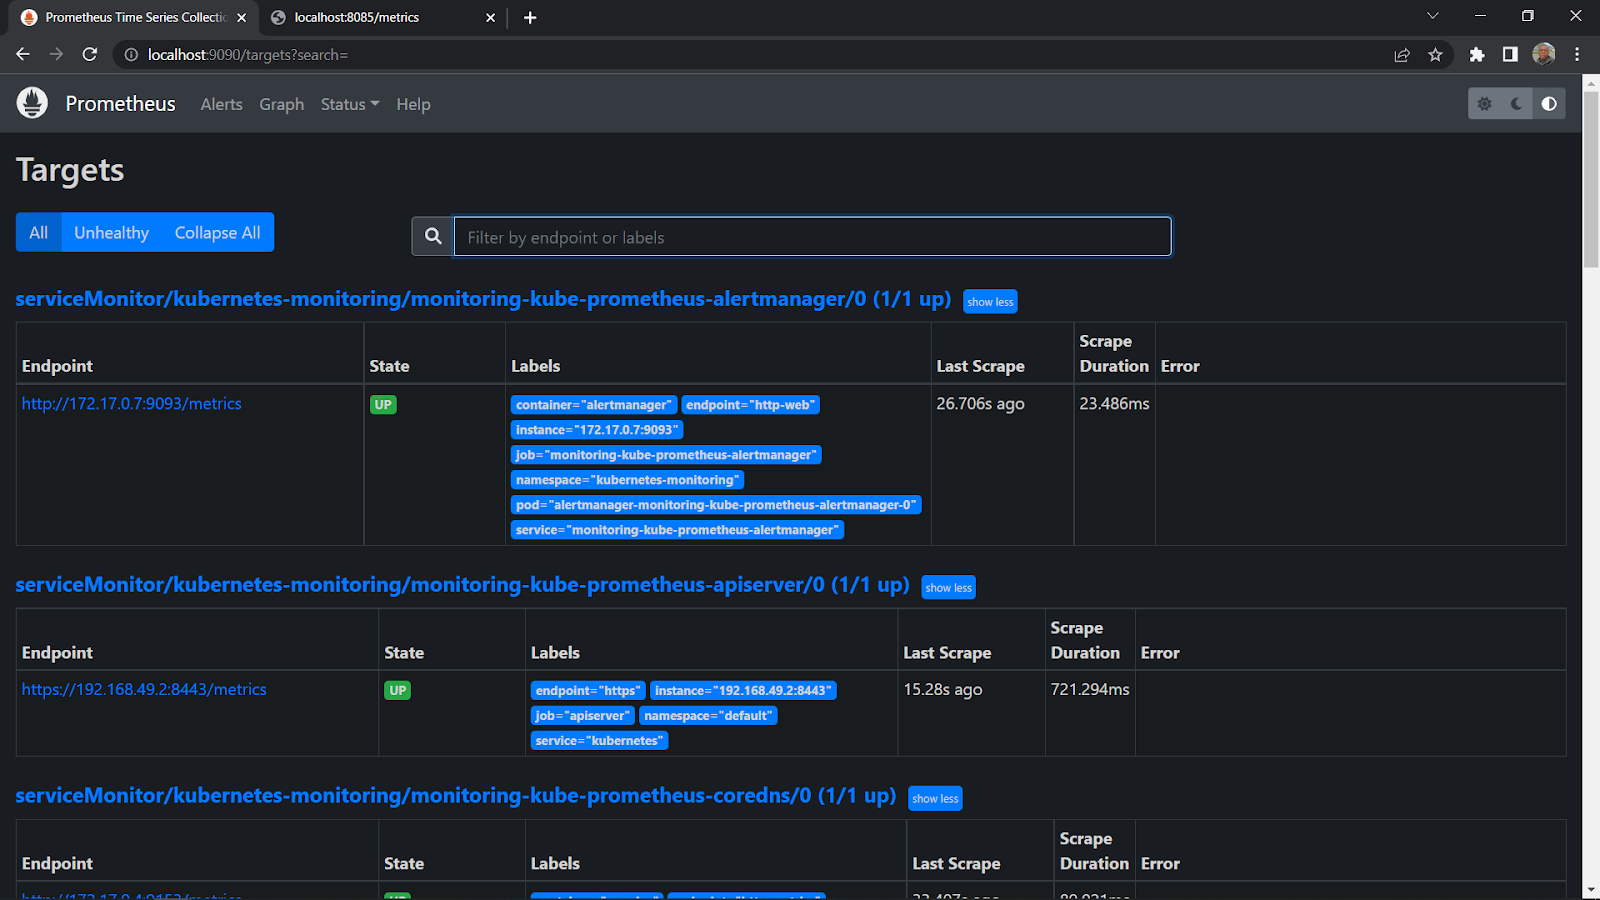
Open a web browser, and navigate to either of the URLs below to access your Prometheus instance.

Navigate to http://localhost:9090 if you’re following along with local windows, Linux, or mac machines. Navigate to your server’s IP address followed by port 9090 (i.e., http://YOUR_SERVER_IP:9090) if you’re using a cloud server.

  1. Visualizing a Cluster’s Internal State Metric on Prometheus

Now, to view the internal status metrics of our Kubernetes cluster, we will now run some Prometheus queries. We'll concentrate on CPU usage. For additional information on the Prometheus query language, You can visit Prometheus’ official website.

  1. Monitoring and Visualizing with Grafana Dashboard

Prometheus visualization options are limited, only a Graph. Prometheus is great for collecting metrics from targets set as tasks, aggregating the metrics, and storing them locally on the workstation. However, when it comes to traditional resource monitoring adding Grafana is a great option.

Metrics produced by server components such as node exporter, CoreDNS, and others are collected by Prometheus. Grafana obtains these metrics from Prometheus and displays them in a number of ways on its dashboard.

  1. Conclusion

In this article, we learned about Kubernetes monitoring using Prometheus and Grafana. We also saw step by step guide to set up Prometheus to Kubernetes cluster nodes and Grafana dashboard to visualize key internal metrics

References:

[1] https://adamtheautomator.com/prometheus-kubernetes/

[2] https://earthly.dev/blog/grafana-and-prometheus-k8s/

[3] https://grafana.com/grafana/dashboards/315-kubernetes-cluster-monitoring-via-prometheus/

[4] https://logz.io/blog/open-source-monitoring-tools-for-kubernetes/

Latest Blogs
This is a decorative image for: A Complete Guide To Customer Acquisition For Startups
October 18, 2022

A Complete Guide To Customer Acquisition For Startups

Any business is enlivened by its customers. Therefore, a strategy to constantly bring in new clients is an ongoing requirement. In this regard, having a proper customer acquisition strategy can be of great importance.

So, if you are just starting your business, or planning to expand it, read on to learn more about this concept.

The problem with customer acquisition

As an organization, when working in a diverse and competitive market like India, you need to have a well-defined customer acquisition strategy to attain success. However, this is where most startups struggle. Now, you may have a great product or service, but if you are not in the right place targeting the right demographic, you are not likely to get the results you want.

To resolve this, typically, companies invest, but if that is not channelized properly, it will be futile.

So, the best way out of this dilemma is to have a clear customer acquisition strategy in place.

How can you create the ideal customer acquisition strategy for your business?

  • Define what your goals are

You need to define your goals so that you can meet the revenue expectations you have for the current fiscal year. You need to find a value for the metrics –

  • MRR – Monthly recurring revenue, which tells you all the income that can be generated from all your income channels.
  • CLV – Customer lifetime value tells you how much a customer is willing to spend on your business during your mutual relationship duration.  
  • CAC – Customer acquisition costs, which tells how much your organization needs to spend to acquire customers constantly.
  • Churn rate – It tells you the rate at which customers stop doing business.

All these metrics tell you how well you will be able to grow your business and revenue.

  • Identify your ideal customers

You need to understand who your current customers are and who your target customers are. Once you are aware of your customer base, you can focus your energies in that direction and get the maximum sale of your products or services. You can also understand what your customers require through various analytics and markers and address them to leverage your products/services towards them.

  • Choose your channels for customer acquisition

How will you acquire customers who will eventually tell at what scale and at what rate you need to expand your business? You could market and sell your products on social media channels like Instagram, Facebook and YouTube, or invest in paid marketing like Google Ads. You need to develop a unique strategy for each of these channels. 

  • Communicate with your customers

If you know exactly what your customers have in mind, then you will be able to develop your customer strategy with a clear perspective in mind. You can do it through surveys or customer opinion forms, email contact forms, blog posts and social media posts. After that, you just need to measure the analytics, clearly understand the insights, and improve your strategy accordingly.

Combining these strategies with your long-term business plan will bring results. However, there will be challenges on the way, where you need to adapt as per the requirements to make the most of it. At the same time, introducing new technologies like AI and ML can also solve such issues easily. To learn more about the use of AI and ML and how they are transforming businesses, keep referring to the blog section of E2E Networks.

Reference Links

https://www.helpscout.com/customer-acquisition/

https://www.cloudways.com/blog/customer-acquisition-strategy-for-startups/

https://blog.hubspot.com/service/customer-acquisition

This is a decorative image for: Constructing 3D objects through Deep Learning
October 18, 2022

Image-based 3D Object Reconstruction State-of-the-Art and trends in the Deep Learning Era

3D reconstruction is one of the most complex issues of deep learning systems. There have been multiple types of research in this field, and almost everything has been tried on it — computer vision, computer graphics and machine learning, but to no avail. However, that has resulted in CNN or convolutional neural networks foraying into this field, which has yielded some success.

The Main Objective of the 3D Object Reconstruction

Developing this deep learning technology aims to infer the shape of 3D objects from 2D images. So, to conduct the experiment, you need the following:

  • Highly calibrated cameras that take a photograph of the image from various angles.
  • Large training datasets can predict the geometry of the object whose 3D image reconstruction needs to be done. These datasets can be collected from a database of images, or they can be collected and sampled from a video.

By using the apparatus and datasets, you will be able to proceed with the 3D reconstruction from 2D datasets.

State-of-the-art Technology Used by the Datasets for the Reconstruction of 3D Objects

The technology used for this purpose needs to stick to the following parameters:

  • Input

Training with the help of one or multiple RGB images, where the segmentation of the 3D ground truth needs to be done. It could be one image, multiple images or even a video stream.

The testing will also be done on the same parameters, which will also help to create a uniform, cluttered background, or both.

  • Output

The volumetric output will be done in both high and low resolution, and the surface output will be generated through parameterisation, template deformation and point cloud. Moreover, the direct and intermediate outputs will be calculated this way.

  • Network architecture used

The architecture used in training is 3D-VAE-GAN, which has an encoder and a decoder, with TL-Net and conditional GAN. At the same time, the testing architecture is 3D-VAE, which has an encoder and a decoder.

  • Training used

The degree of supervision used in 2D vs 3D supervision, weak supervision along with loss functions have to be included in this system. The training procedure is adversarial training with joint 2D and 3D embeddings. Also, the network architecture is extremely important for the speed and processing quality of the output images.

  • Practical applications and use cases

Volumetric representations and surface representations can do the reconstruction. Powerful computer systems need to be used for reconstruction.

Given below are some of the places where 3D Object Reconstruction Deep Learning Systems are used:

  • 3D reconstruction technology can be used in the Police Department for drawing the faces of criminals whose images have been procured from a crime site where their faces are not completely revealed.
  • It can be used for re-modelling ruins at ancient architectural sites. The rubble or the debris stubs of structures can be used to recreate the entire building structure and get an idea of how it looked in the past.
  • They can be used in plastic surgery where the organs, face, limbs or any other portion of the body has been damaged and needs to be rebuilt.
  • It can be used in airport security, where concealed shapes can be used for guessing whether a person is armed or is carrying explosives or not.
  • It can also help in completing DNA sequences.

So, if you are planning to implement this technology, then you can rent the required infrastructure from E2E Networks and avoid investing in it. And if you plan to learn more about such topics, then keep a tab on the blog section of the website

Reference Links

https://tongtianta.site/paper/68922

https://github.com/natowi/3D-Reconstruction-with-Deep-Learning-Methods

This is a decorative image for: Comprehensive Guide to Deep Q-Learning for Data Science Enthusiasts
October 18, 2022

A Comprehensive Guide To Deep Q-Learning For Data Science Enthusiasts

For all data science enthusiasts who would love to dig deep, we have composed a write-up about Q-Learning specifically for you all. Deep Q-Learning and Reinforcement learning (RL) are extremely popular these days. These two data science methodologies use Python libraries like TensorFlow 2 and openAI’s Gym environment.

So, read on to know more.

What is Deep Q-Learning?

Deep Q-Learning utilizes the principles of Q-learning, but instead of using the Q-table, it uses the neural network. The algorithm of deep Q-Learning uses the states as input and the optimal Q-value of every action possible as the output. The agent gathers and stores all the previous experiences in the memory of the trained tuple in the following order:

State> Next state> Action> Reward

The neural network training stability increases using a random batch of previous data by using the experience replay. Experience replay also means the previous experiences stocking, and the target network uses it for training and calculation of the Q-network and the predicted Q-Value. This neural network uses openAI Gym, which is provided by taxi-v3 environments.

Now, any understanding of Deep Q-Learning   is incomplete without talking about Reinforcement Learning.

What is Reinforcement Learning?

Reinforcement is a subsection of ML. This part of ML is related to the action in which an environmental agent participates in a reward-based system and uses Reinforcement Learning to maximize the rewards. Reinforcement Learning is a different technique from unsupervised learning or supervised learning because it does not require a supervised input/output pair. The number of corrections is also less, so it is a highly efficient technique.

Now, the understanding of reinforcement learning is incomplete without knowing about Markov Decision Process (MDP). MDP is involved with each state that has been presented in the results of the environment, derived from the state previously there. The information which composes both states is gathered and transferred to the decision process. The task of the chosen agent is to maximize the awards. The MDP optimizes the actions and helps construct the optimal policy.

For developing the MDP, you need to follow the Q-Learning Algorithm, which is an extremely important part of data science and machine learning.

What is Q-Learning Algorithm?

The process of Q-Learning is important for understanding the data from scratch. It involves defining the parameters, choosing the actions from the current state and also choosing the actions from the previous state and then developing a Q-table for maximizing the results or output rewards.

The 4 steps that are involved in Q-Learning:

  1. Initializing parameters – The RL (reinforcement learning) model learns the set of actions that the agent requires in the state, environment and time.
  2. Identifying current state – The model stores the prior records for optimal action definition for maximizing the results. For acting in the present state, the state needs to be identified and perform an action combination for it.
  3. Choosing the optimal action set and gaining the relevant experience – A Q-table is generated from the data with a set of specific states and actions, and the weight of this data is calculated for updating the Q-Table to the following step.
  4. Updating Q-table rewards and next state determination – After the relevant experience is gained and agents start getting environmental records. The reward amplitude helps to present the subsequent step.  

In case the Q-table size is huge, then the generation of the model is a time-consuming process. This situation requires Deep Q-learning.

Hopefully, this write-up has provided an outline of Deep Q-Learning and its related concepts. If you wish to learn more about such topics, then keep a tab on the blog section of the E2E Networks website.

Reference Links

https://analyticsindiamag.com/comprehensive-guide-to-deep-q-learning-for-data-science-enthusiasts/

https://medium.com/@jereminuerofficial/a-comprehensive-guide-to-deep-q-learning-8aeed632f52f

This is a decorative image for: GAUDI: A Neural Architect for Immersive 3D Scene Generation
October 13, 2022

GAUDI: A Neural Architect for Immersive 3D Scene Generation

The evolution of artificial intelligence in the past decade has been staggering, and now the focus is shifting towards AI and ML systems to understand and generate 3D spaces. As a result, there has been extensive research on manipulating 3D generative models. In this regard, Apple’s AI and ML scientists have developed GAUDI, a method specifically for this job.

An introduction to GAUDI

The GAUDI 3D immersive technique founders named it after the famous architect Antoni Gaudi. This AI model takes the help of a camera pose decoder, which enables it to guess the possible camera angles of a scene. Hence, the decoder then makes it possible to predict the 3D canvas from almost every angle.

What does GAUDI do?

GAUDI can perform multiple functions –

  • The extensions of these generative models have a tremendous effect on ML and computer vision. Pragmatically, such models are highly useful. They are applied in model-based reinforcement learning and planning world models, SLAM is s, or 3D content creation.
  • Generative modelling for 3D objects has been used for generating scenes using graf, pigan, and gsn, which incorporate a GAN (Generative Adversarial Network). The generator codes radiance fields exclusively. Using the 3D space in the scene along with the camera pose generates the 3D image from that point. This point has a density scalar and RGB value for that specific point in 3D space. This can be done from a 2D camera view. It does this by imposing 3D datasets on those 2D shots. It isolates various objects and scenes and combines them to render a new scene altogether.
  • GAUDI also removes GANs pathologies like mode collapse and improved GAN.
  • GAUDI also uses this to train data on a canonical coordinate system. You can compare it by looking at the trajectory of the scenes.

How is GAUDI applied to the content?

The steps of application for GAUDI have been given below:

  • Each trajectory is created, which consists of a sequence of posed images (These images are from a 3D scene) encoded into a latent representation. This representation which has a radiance field or what we refer to as the 3D scene and the camera path is created in a disentangled way. The results are interpreted as free parameters. The problem is optimized by and formulation of a reconstruction objective.
  • This simple training process is then scaled to trajectories, thousands of them creating a large number of views. The model samples the radiance fields totally from the previous distribution that the model has learned.
  • The scenes are thus synthesized by interpolation within the hidden space.
  • The scaling of 3D scenes generates many scenes that contain thousands of images. During training, there is no issue related to canonical orientation or mode collapse.
  • A novel de-noising optimization technique is used to find hidden representations that collaborate in modelling the camera poses and the radiance field to create multiple datasets with state-of-the-art performance in generating 3D scenes by building a setup that uses images and text.

To conclude, GAUDI has more capabilities and can also be used for sampling various images and video datasets. Furthermore, this will make a foray into AR (augmented reality) and VR (virtual reality). With GAUDI in hand, the sky is only the limit in the field of media creation. So, if you enjoy reading about the latest development in the field of AI and ML, then keep a tab on the blog section of the E2E Networks website.

Reference Links

https://www.researchgate.net/publication/362323995_GAUDI_A_Neural_Architect_for_Immersive_3D_Scene_Generation

https://www.technology.org/2022/07/31/gaudi-a-neural-architect-for-immersive-3d-scene-generation/ 

https://www.patentlyapple.com/2022/08/apple-has-unveiled-gaudi-a-neural-architect-for-immersive-3d-scene-generation.html

Build on the most powerful infrastructure cloud

A vector illustration of a tech city using latest cloud technologies & infrastructure